|
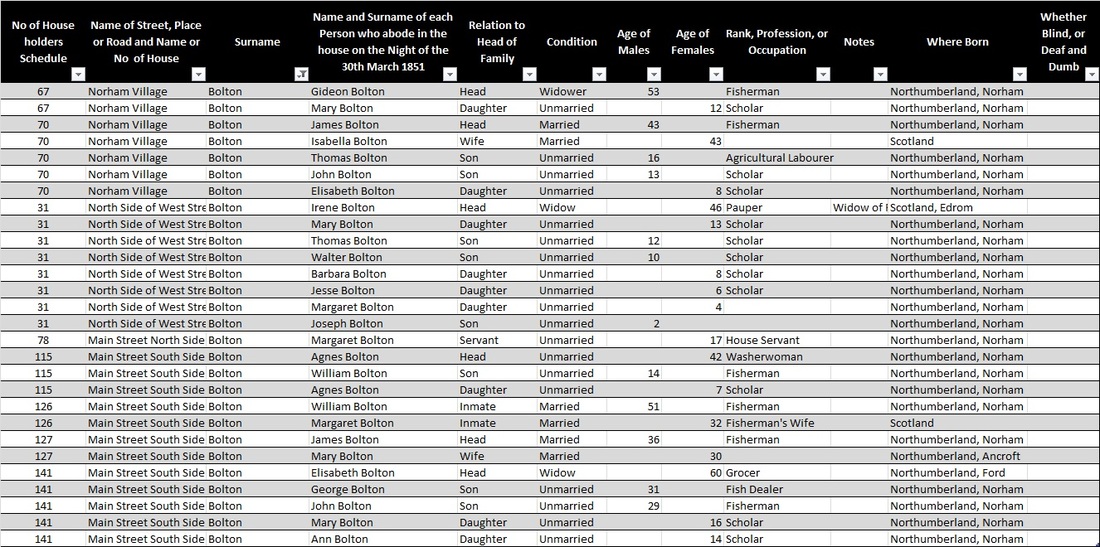
I would start by saying that this exercise is not for everyone, can be time consuming and laborious. However, for those of us with a large cluster of ancestors in one parish, or someone (like myself) who is undertaking a One Place Study, the rewards are manifold. In my case it is the Parish of Norham, situated on the River Tweed and an ancient crossing point between England and Scotland. Evidence exists of a prehistoric settlement and the Church of St Cuthbert founded in 830AD illustrates the close religious links with Lindisfarne and its once administrative role as “Capital” of the northern region of the Palatinate of Durham. The census chosen for this exercise is 1851. Firstly as it is the first census with any really useful information. Secondly as it falls in the period between the social reformer Rev W S Gilly, sometime vicar of Norham, and his report on the living conditions of the “Border Peasantry” in 1841/42 and the “Nuisances Removal and Diseases Prevention Consolidation and Amendment Act of 1855”. The latter resulted in this enlightening report written in 1862 written by the then Inspector William Grey Marshall. It tells of the “nuisances” and living conditions being experienced by the inhabitants of Norham Parish at that time. A couple of examples extracted from GBR46/203-204. Dated 7 July 1862 and the following month on the conditions of agricultural workers at Norham Mains GBR46/223-226. Dated 18 Aug. 1862. “A nuisance is caused by James Young, mason, keeping a pig in an old building “I have also to report to the Board the condition in which I found some Hinds’ houses at Full transcript of these reports is available at:- http://www.berwickfriends.org.uk/wp-content/uploads/2013/11/Norham-1862-report-to-Board-of-Guardians.pdf The trick with the census is not to simply transcribe verbatim what you see, but to add extra fields like surname only, and a column noting employers and how many employed, so the 10 columns on the original census effectively becomes 12. Enter these into a simple spreadsheet like MS Excel , typing address and surname information in full each time. See example below:- Then you can apply filters across the columns, which can be used singly, i.e. just surname, address, birthplace etc., or in a combination say surname + birthplace, or surname +birthplace +occupation see examples below: When applied to single columns such as age, occupation and so on it is then possible to calculate these as percentages of the total population of the parish at the time. Repeating this exercise with subsequent census records can illustrate the changes within the population, such as average age, occupation percentages, numbers of employers, number of households etc.
Just remember to factor in changes to the enumeration districts and the painstaking effort you took over entering the information will result in a far deeper understanding of the Parish or Place you are studying. As you cross the generations, names become so familiar, as folks marry, have children of their own, and then pass away, they begin to feel like real family!
0 Comments
Leave a Reply. |
AuthorSusie Douglas Archives
December 2021
Categories |
Copyright © 2013 Borders Ancestry
Borders Ancestry is registered with the Information Commissioner's Office No ZA226102 https://ico.org.uk. Read our Privacy Policy


 RSS Feed

